Number-crunching, or how to use crap graphs
Warning! There is a built-in statistical flaw in that the start of year analysis is based on estimations and guesses before all those selected were properly identified, whereas those who died are a sample of the whole number of selections. Do you really care?
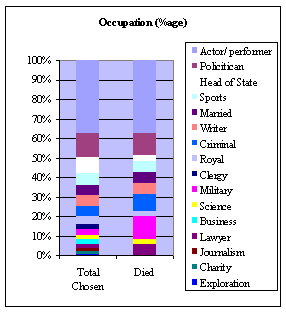
Occupations
| Occupation | Number chosen | Number died | ||
| Actor/performer | 95 | 35.6% | 13 | 35.0% |
| Policitican | 31 | 11.6% | 4 | 10.8% |
| Head of state | 21 | 7.9% | 1 | 2.7% |
| Sports | 16 | 6.0% | 2 | 5.4% |
| Married | 14 | 5.2% | 2 | 5.4% |
| Writer | 14 | 5.2% | 2 | 5.4% |
| Criminal | 12 | 4.5% | 3 | 8.1% |
| Royal | 11 | 4.1% | 1 | 2.7% |
| Clergy | 7 | 2.6% | 0 | 0.0% |
| Military | 7 | 2.6% | 4 | 10.8% |
| Science | 6 | 2.2% | 1 | 2.7% |
| Business | 6 | 2.2% | 0 | 0.0% |
| Lawyer | 5 | 1.9% | 2 | 5.4% |
| Journalism | 4 | 1.5% | 0 | 0.0% |
| Charity | 4 | 1.5% | 0 | 0.0% |
| Exploration | 2 | 0.7% | 0 | 0.0% |
| Merely being Very Old | 2 | 0.7% | 2 | 5.4% |
As with the original analysis, people can score with more than one occupation (Idi Amin counts as a former head of state, criminal and in the military). The comments there show how fluid and vague the categories are. The usefulness of this exercise is further invalidated because when the original analysis was done at the start of the year, not all the choices could be identified.
The trick in interpreting the table is to compare the two percentage figures. Although the performing arts and politics dominate the field, they score proportionately (that is, although 35% of those dying were performers, that's to be expected, as they formed 35% of those chosen). Heads of state scored proportionately lower than expected, and the military and those involved in scandal (in the catch-all category "criminals") proportionately highly – which is odd, given the overlap in the three categories!

But there were no real surprises, and nothing that is worth the effort of drawing up the table.
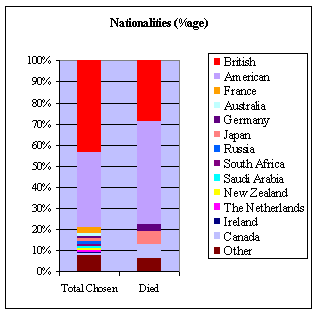
Nationalities
| Nationality | Number chosen | Number died | ||
| UK | 97 | 43.7% | 9 | 29.0% |
| USA | 80 | 36.0.0% | 15 | 48.4% |
| France | 6 | 2.7% | 0 | 0.0% |
| Germany | 3 | 1.4% | 1 | 3.2% |
| Japan | 3 | 1.4% | 2 | 6.5% |
| Russia | 3 | 1.4% | 0 | 0.0% |
| Canada | 3 | 1.4% | 2 | 6.5% |
| Ireland | 2 | 0.9% | 0 | 0.0% |
| The Netherlands | 2 | 0.9% | 0 | 0.0% |
| New Zealand | 2 | 0.9% | 0 | 0.0% |
| Saudi Arabia | 2 | 0.9% | 0 | 0.0% |
| South Africa | 2 | 0.9% | 0 | 0.0% |
| Argentina | 1 | 0.5% | 0 | 0.0% |
| Chile | 1 | 0.5% | 0 | 0.0% |
| China | 1 | 0.5% | 1 | 3.2% |
| Czech Republic | 1 | 0.5% | 0 | 0.0% |
| Colombia | 1 | 0.5% | 0 | 0.0% |
| Indonesia | 1 | 0.5% | 0 | 0.0% |
| Iraq | 1 | 0.5% | 0 | 0.0% |
| Israel | 1 | 0.5% | 0 | 0.0% |
| Monaco | 1 | 0.5% | 0 | 0.0% |
| Palestine | 1 | 0.5% | 0 | 0.0% |
| Phillippines | 1 | 0.5% | 0 | 0.0% |
| Poland | 1 | 0.5% | 0 | 0.0% |
| Thailand | 1 | 0.5% | 0 | 0.0% |
| Sweden | 1 | 0.5% | 0 | 0.0% |
| Turkey | 1 | 0.5% | 0 | 0.0% |
| Uganda | 1 | 0.5% | 1 | 3.2% |
| Zimbabwe | 1 | 0.5% | 0 | 0.0% |
Again, there's not a lot to be said about these results.
Although Brits outnumbered Americans by 44% to 36%, in the final results this was reversed. This is basically due to the fact that although only 9% of the Brits selected died, over 18% of Americans did. Why this should be isn't clear.

All the Japanese selected died, but as these were the oldest man and woman in the world, it's hardly a surprise.
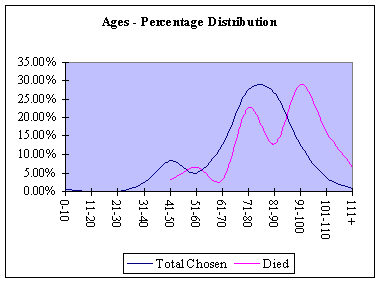
Ages
| Age | Number chosen | Number died | ||
| 0–10 | 1 | 0.5% | 0 | 0.0% |
| 11–20 | 0 | 0.0% | 0 | 0.0% |
| 21–30 | 0 | 0.0% | 0 | 0.0% |
| 31–40 | 5 | 2.3% | 0 | 0.0% |
| 41–50 | 18 | 8.3% | 1 | 3.2% |
| 51–60 | 11 | 5.0% | 2 | 6.5% |
| 61–70 | 28 | 12.8% | 1 | 3.2% |
| 71–80 | 60 | 27.5% | 7 | 22.6% |
| 81–90 | 58 | 26.6% | 4 | 12.9% |
| 91–100 | 27 | 12.4% | 9 | 29.0% |
| 101–110 | 8 | 3.7% | 5 | 16.1% |
| 111+ | 2 | 0.9% | 2 | 6.5% |
The youngest hit of the year (and the only one under 50) was Paul Daisley, who picked up 5 points for Otis, You Want A Treat? and The Raven, and 10 points for Joker-using Whittaker's Choice.
The oldest hit was Kamato Hongo, the world's oldest woman, who scored 4 points for JoeRam, One Foot In The Grave and Tim R. Yukichi Chuganji, her male counterpart, who died aged 114, scored 5 points for One Foot In The Grave.
The inane analysis conducted at the beginning of the year pointed out that most of us had reached the startling conclusion that older people are more likely to die than older ones.

This is demonstrated on the graph by the fact that the blue curve (representing the age distribution of all selections) is shifted to the right. However, the fact that the purple curve (representing the distribution of actual deaths) is shifted even further to the right suggests that most of us were pessimistic regarding celebs' life expectancies, and that it's the even older people who are likely to die – over 20% of those who died were over 101 (two more were 100).
It's to be hoped that this doesn't turn the game into one of those boring lists of people over 100 – with everyone choosing The World's Oldest Man/Woman. To my mind, this is reason enough to justify the judges' decision for 2004 to increase the lower age cutoff and give bonuses to those hits aged under 50 (rather than 40, as was the case for 2003). In 2003, only one would have qualified (Paul Daisley, the youngest hit of the year).
There's one last page of end-of-year analysis if you're up for it...